


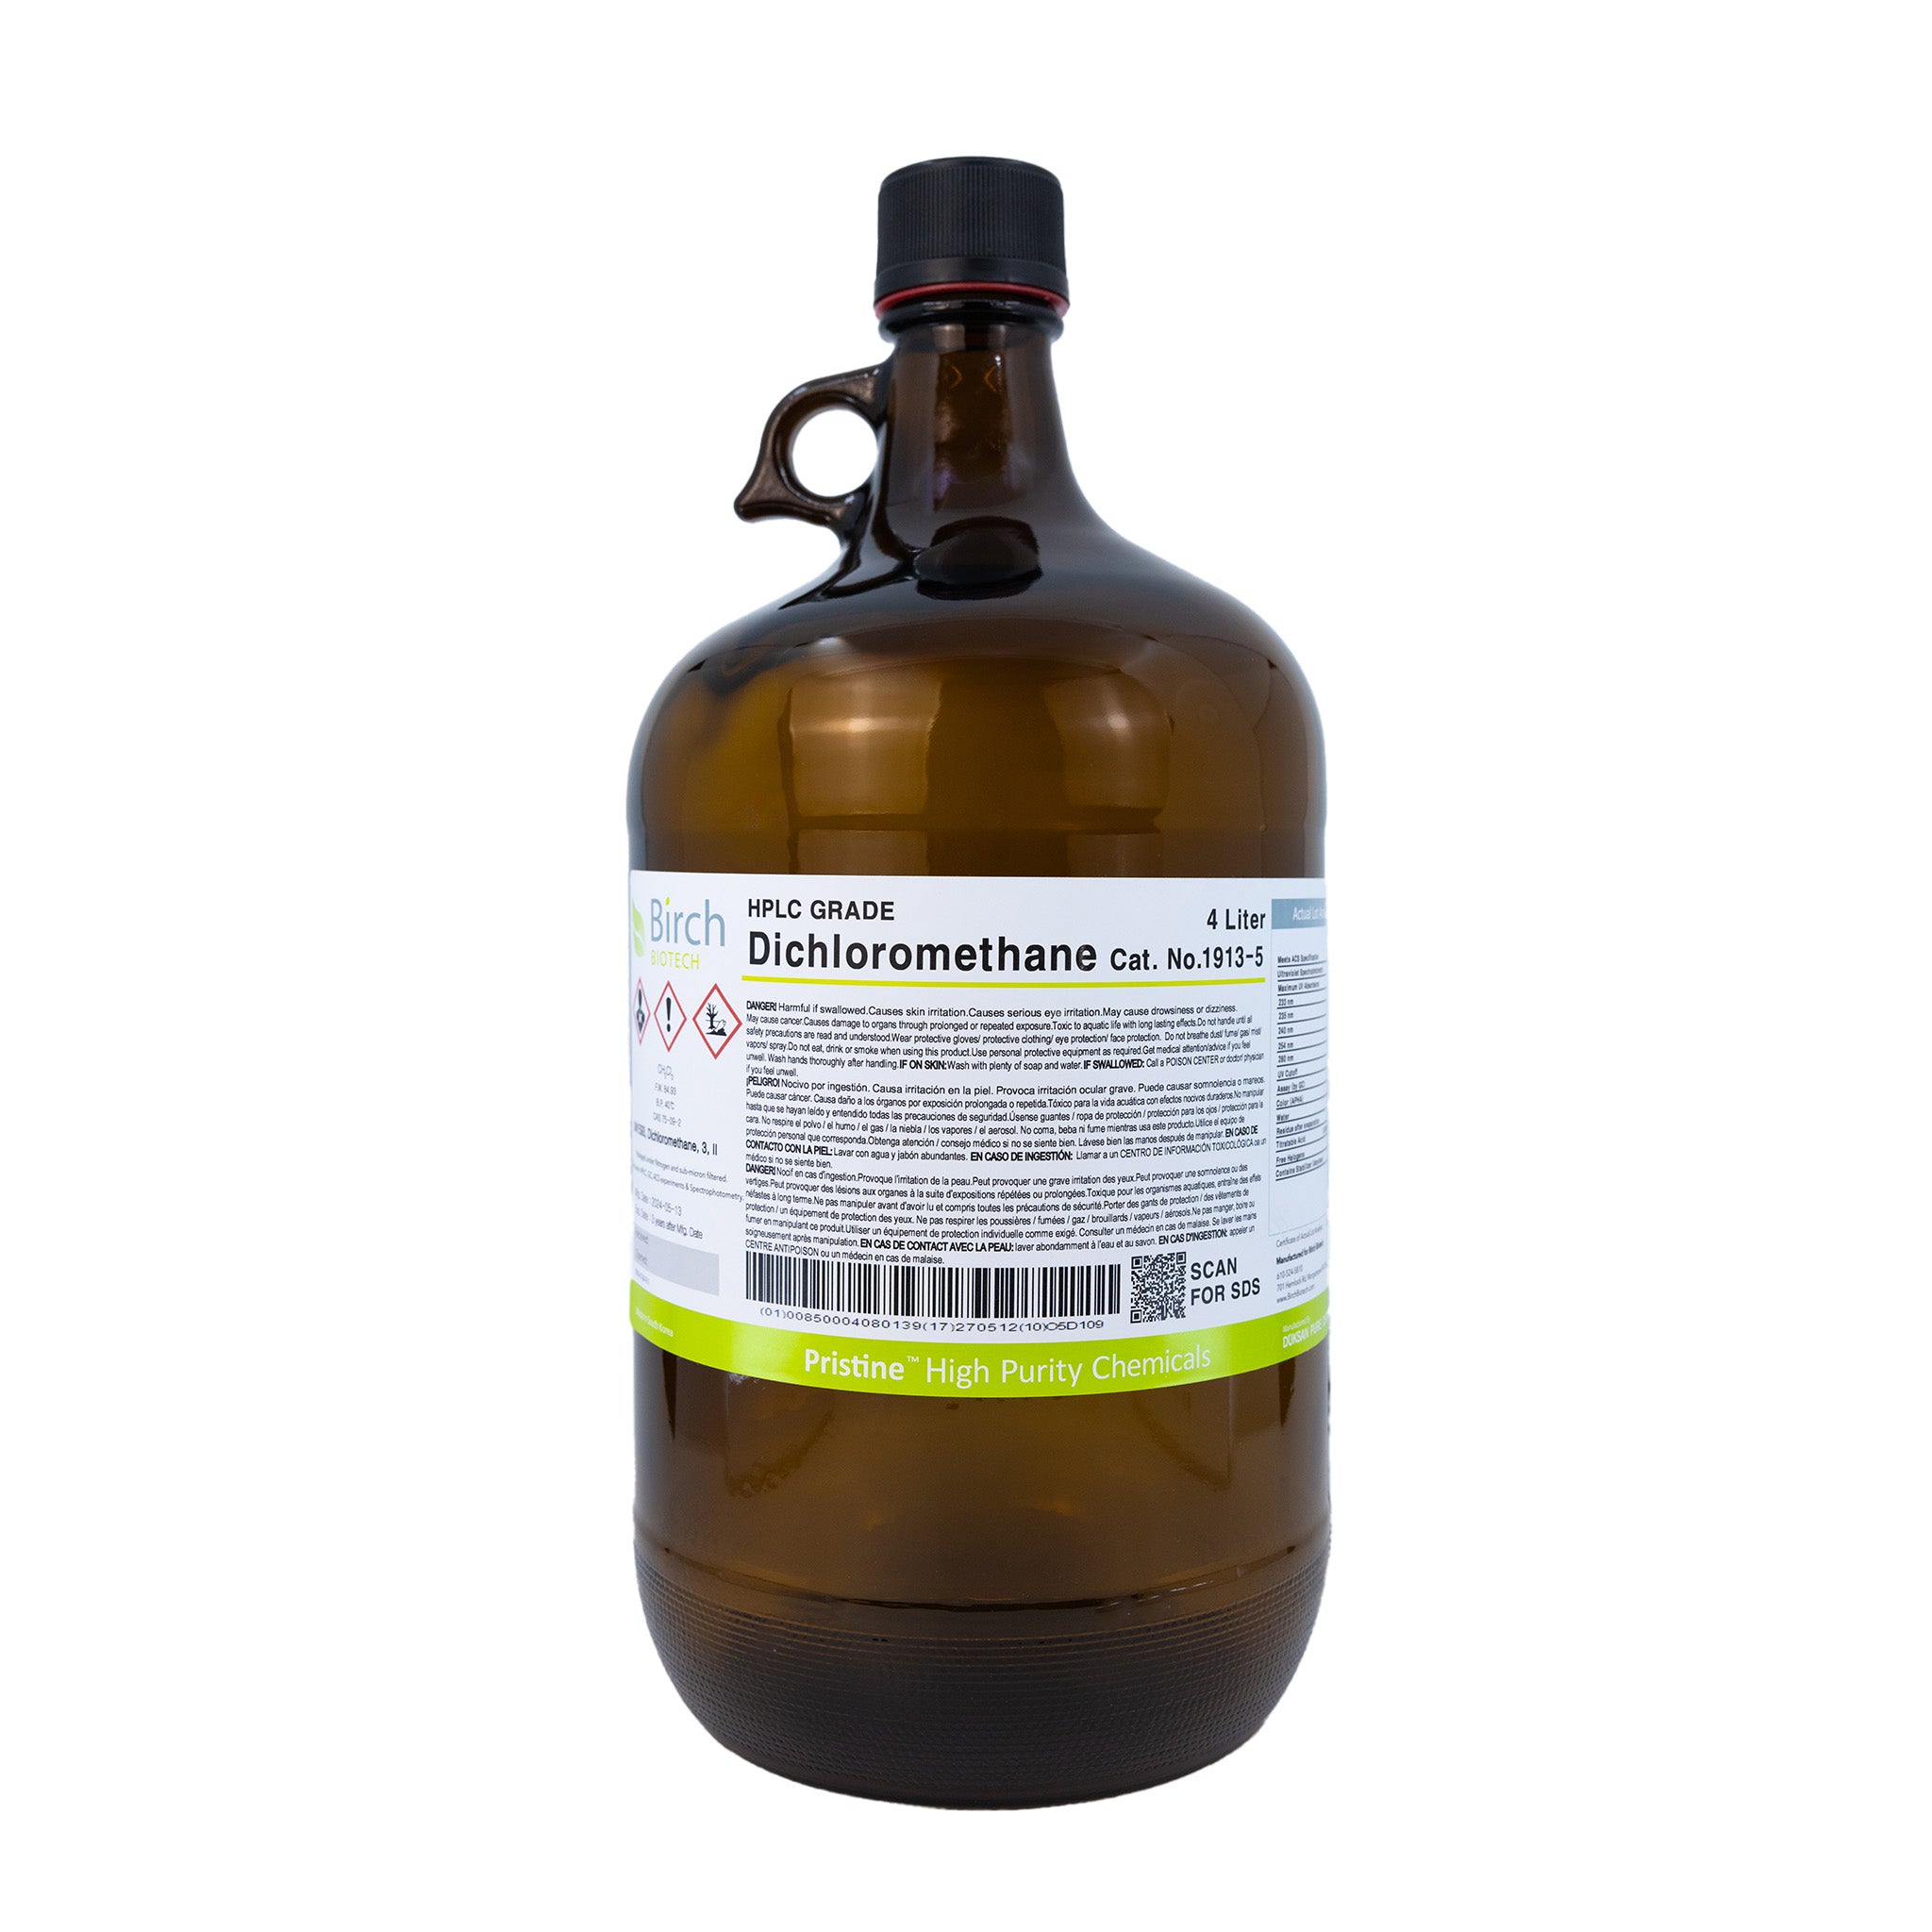


Dichloromethane Safety for Handlers & Environment
Explore key insights about dichloromethane, including its applications, safety measures, and chemical structure.

How Do You Dispose of Acetonitrile
Discover uses, hazards, and safe disposal methods for acetonitrile.
LC-MS Purity and Solvent Contamination Prevention
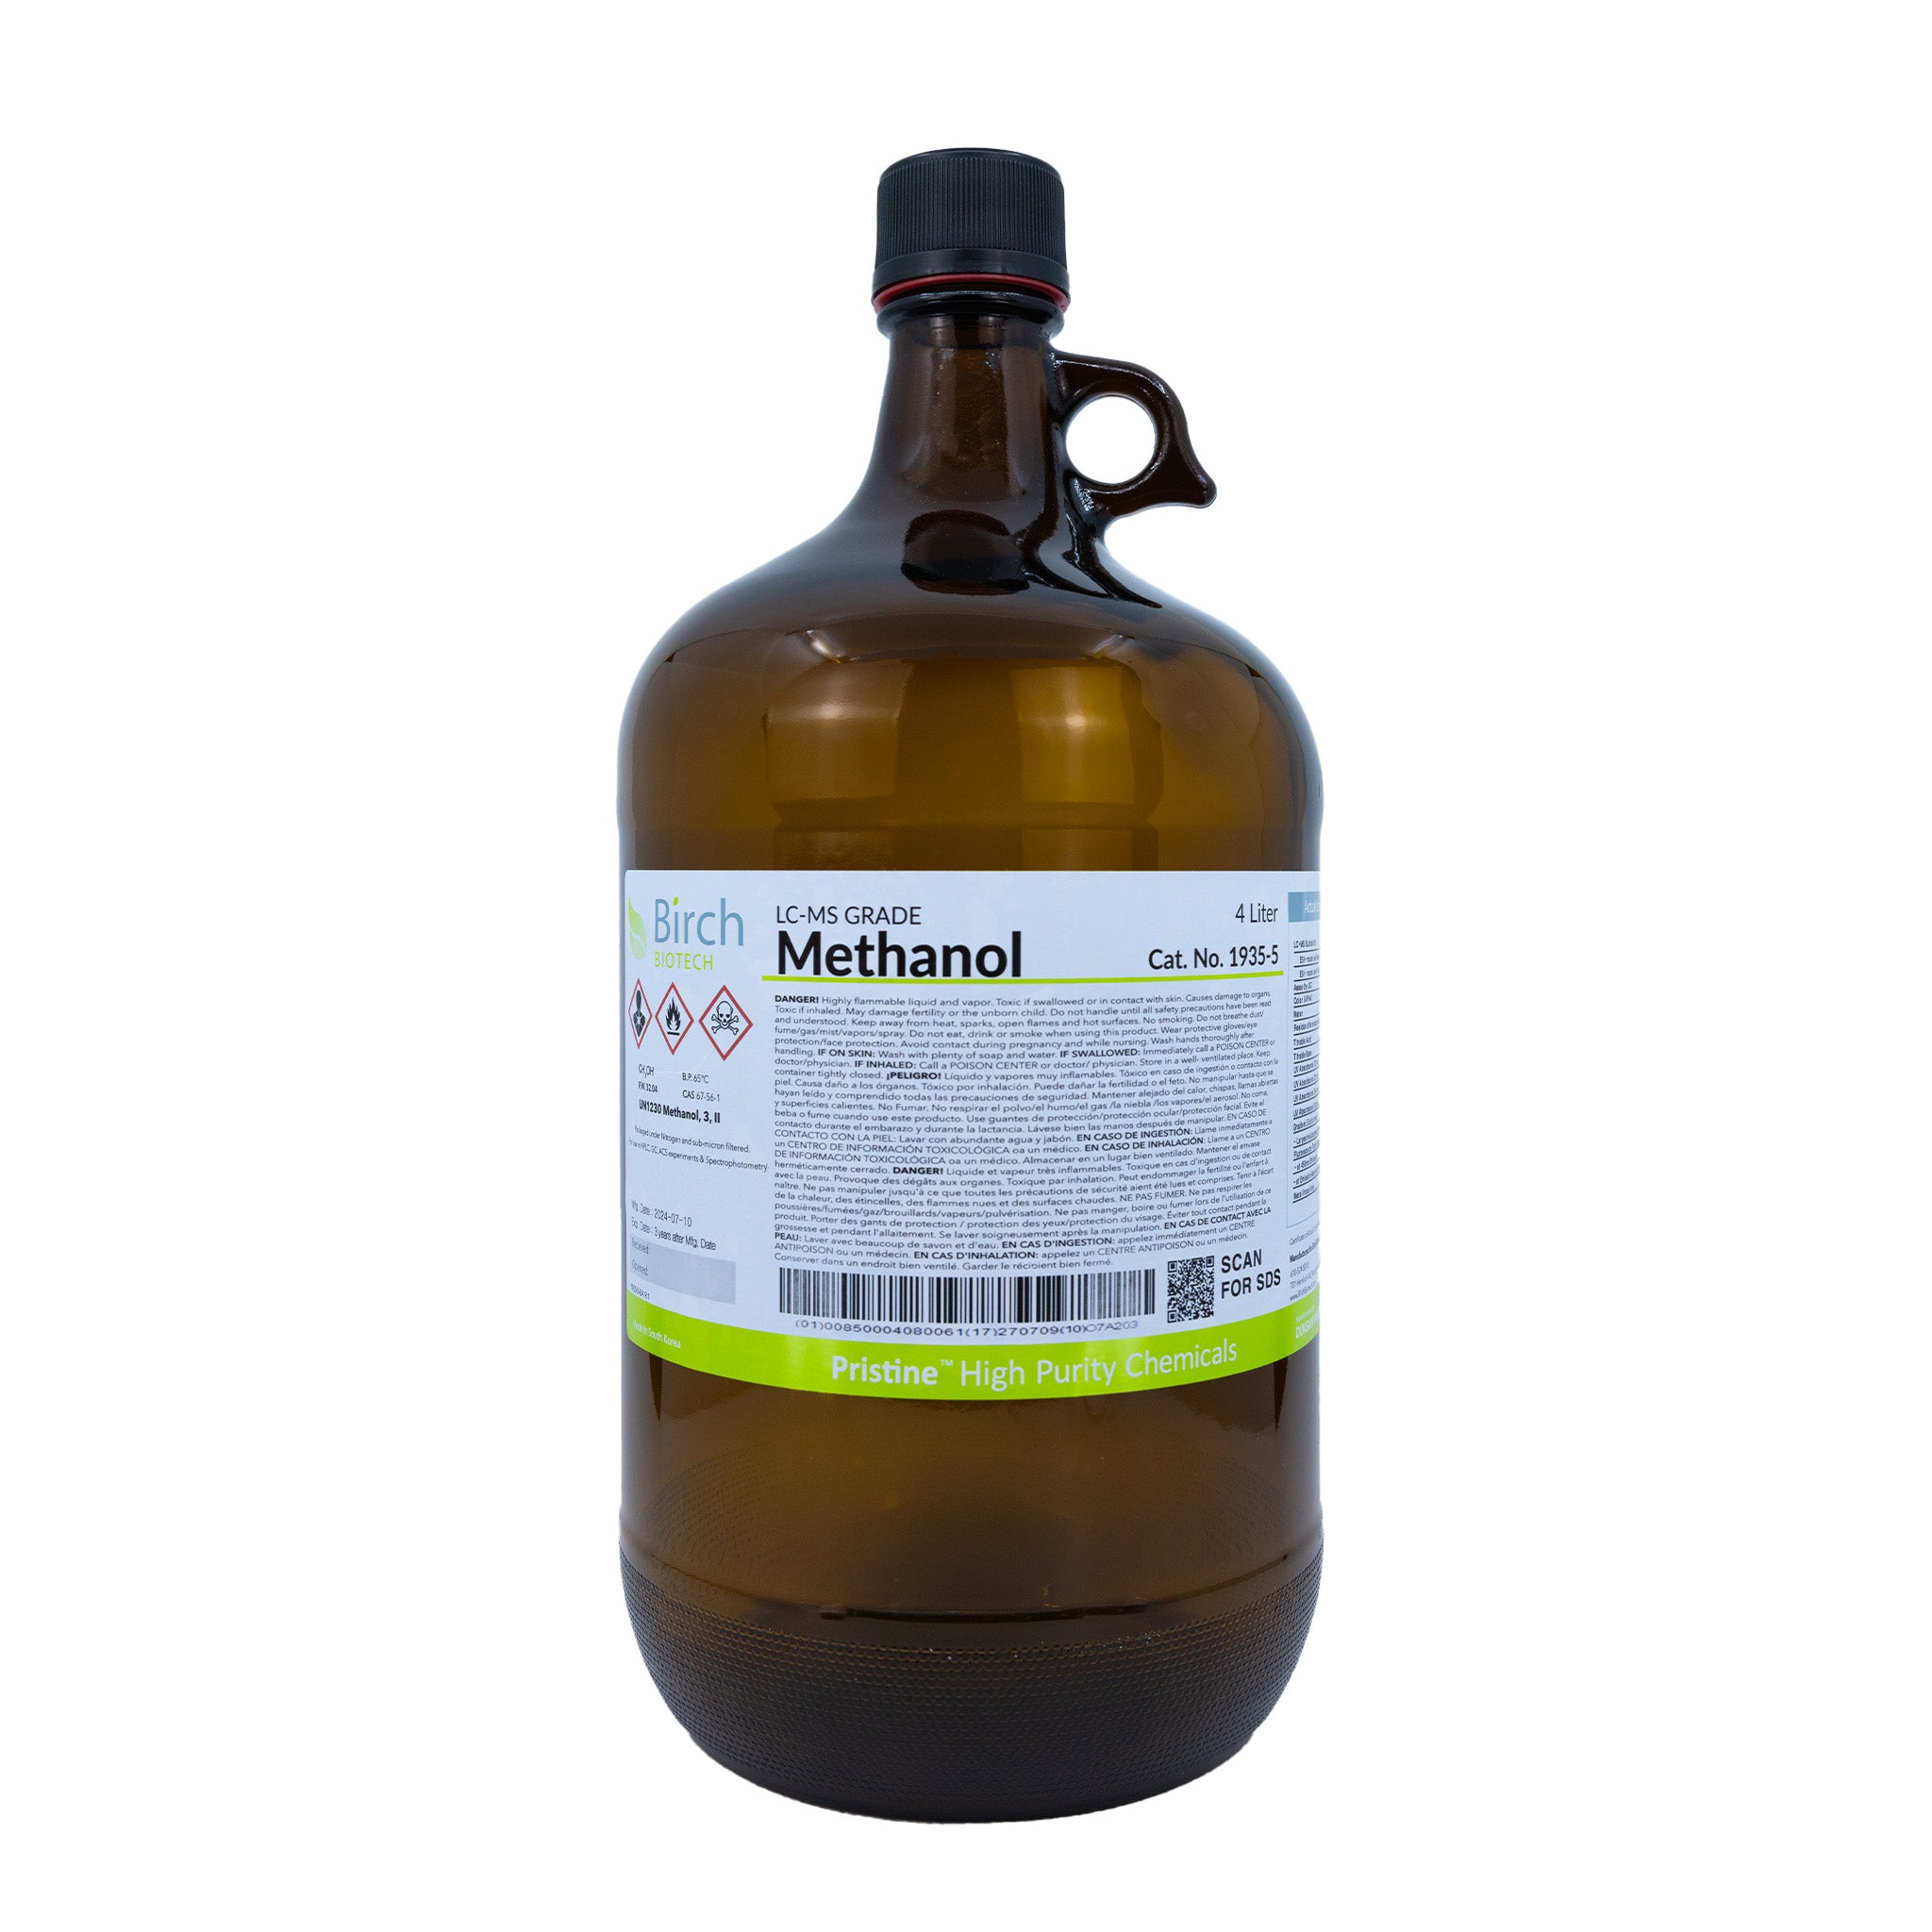
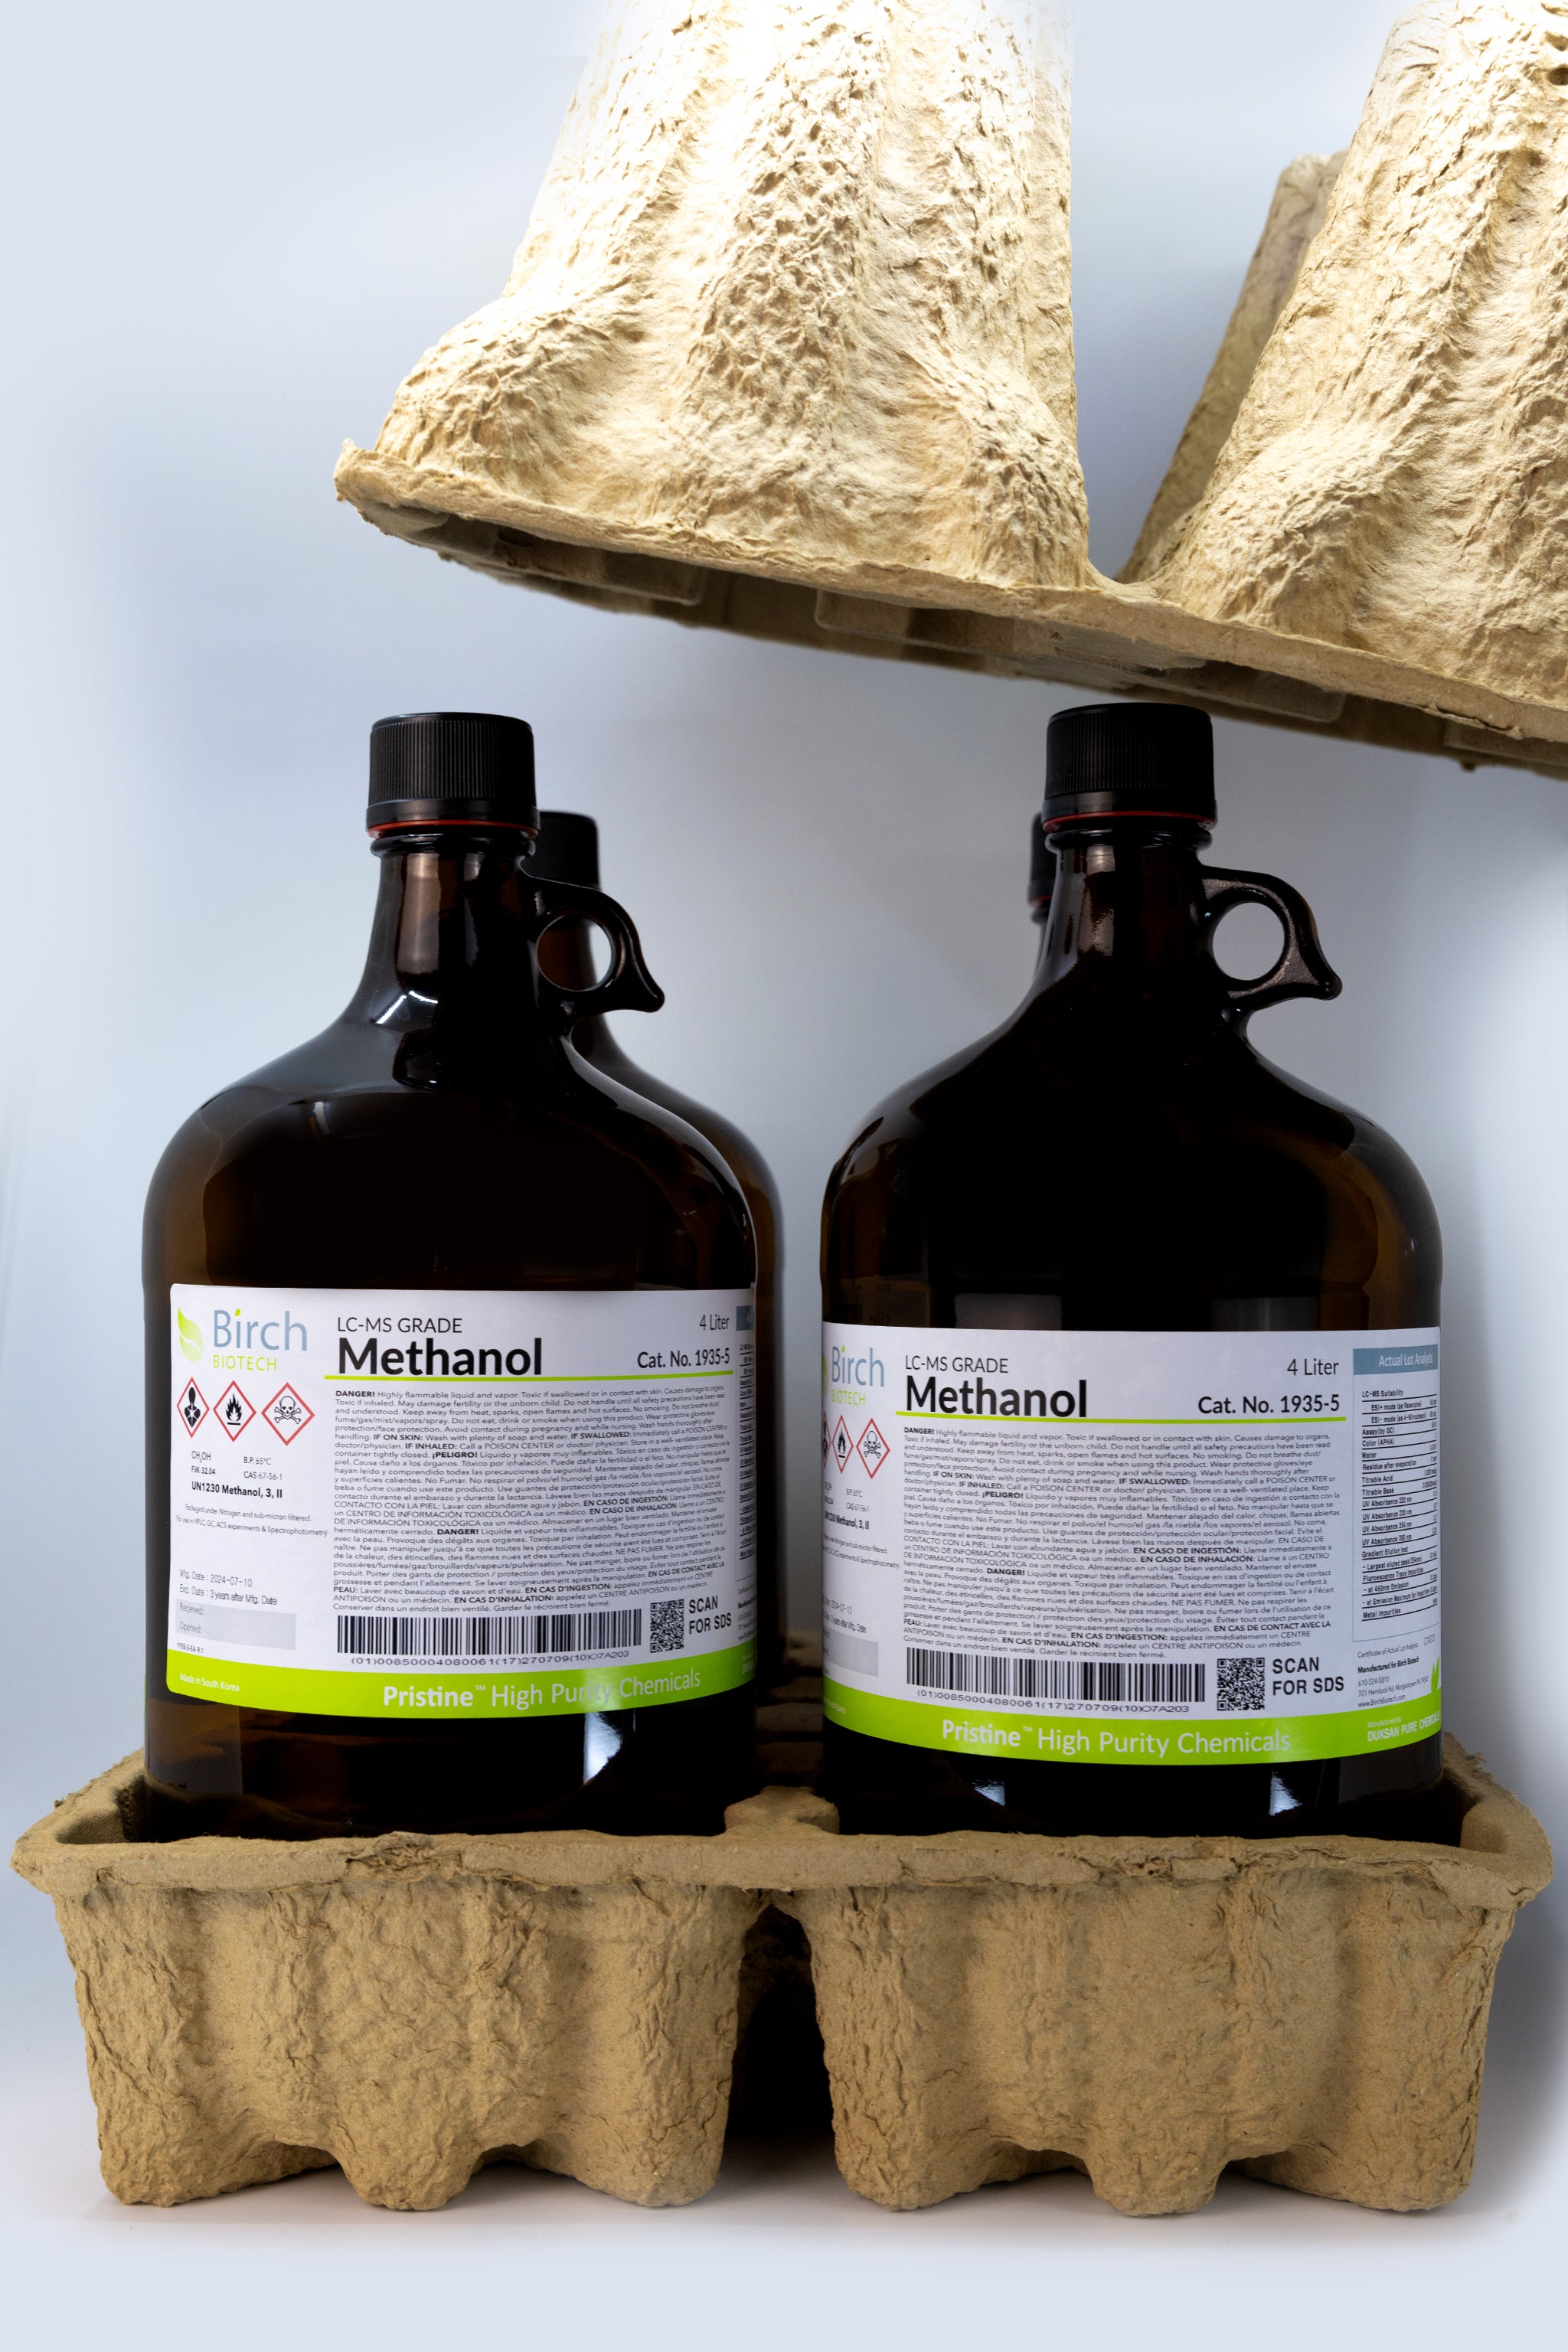
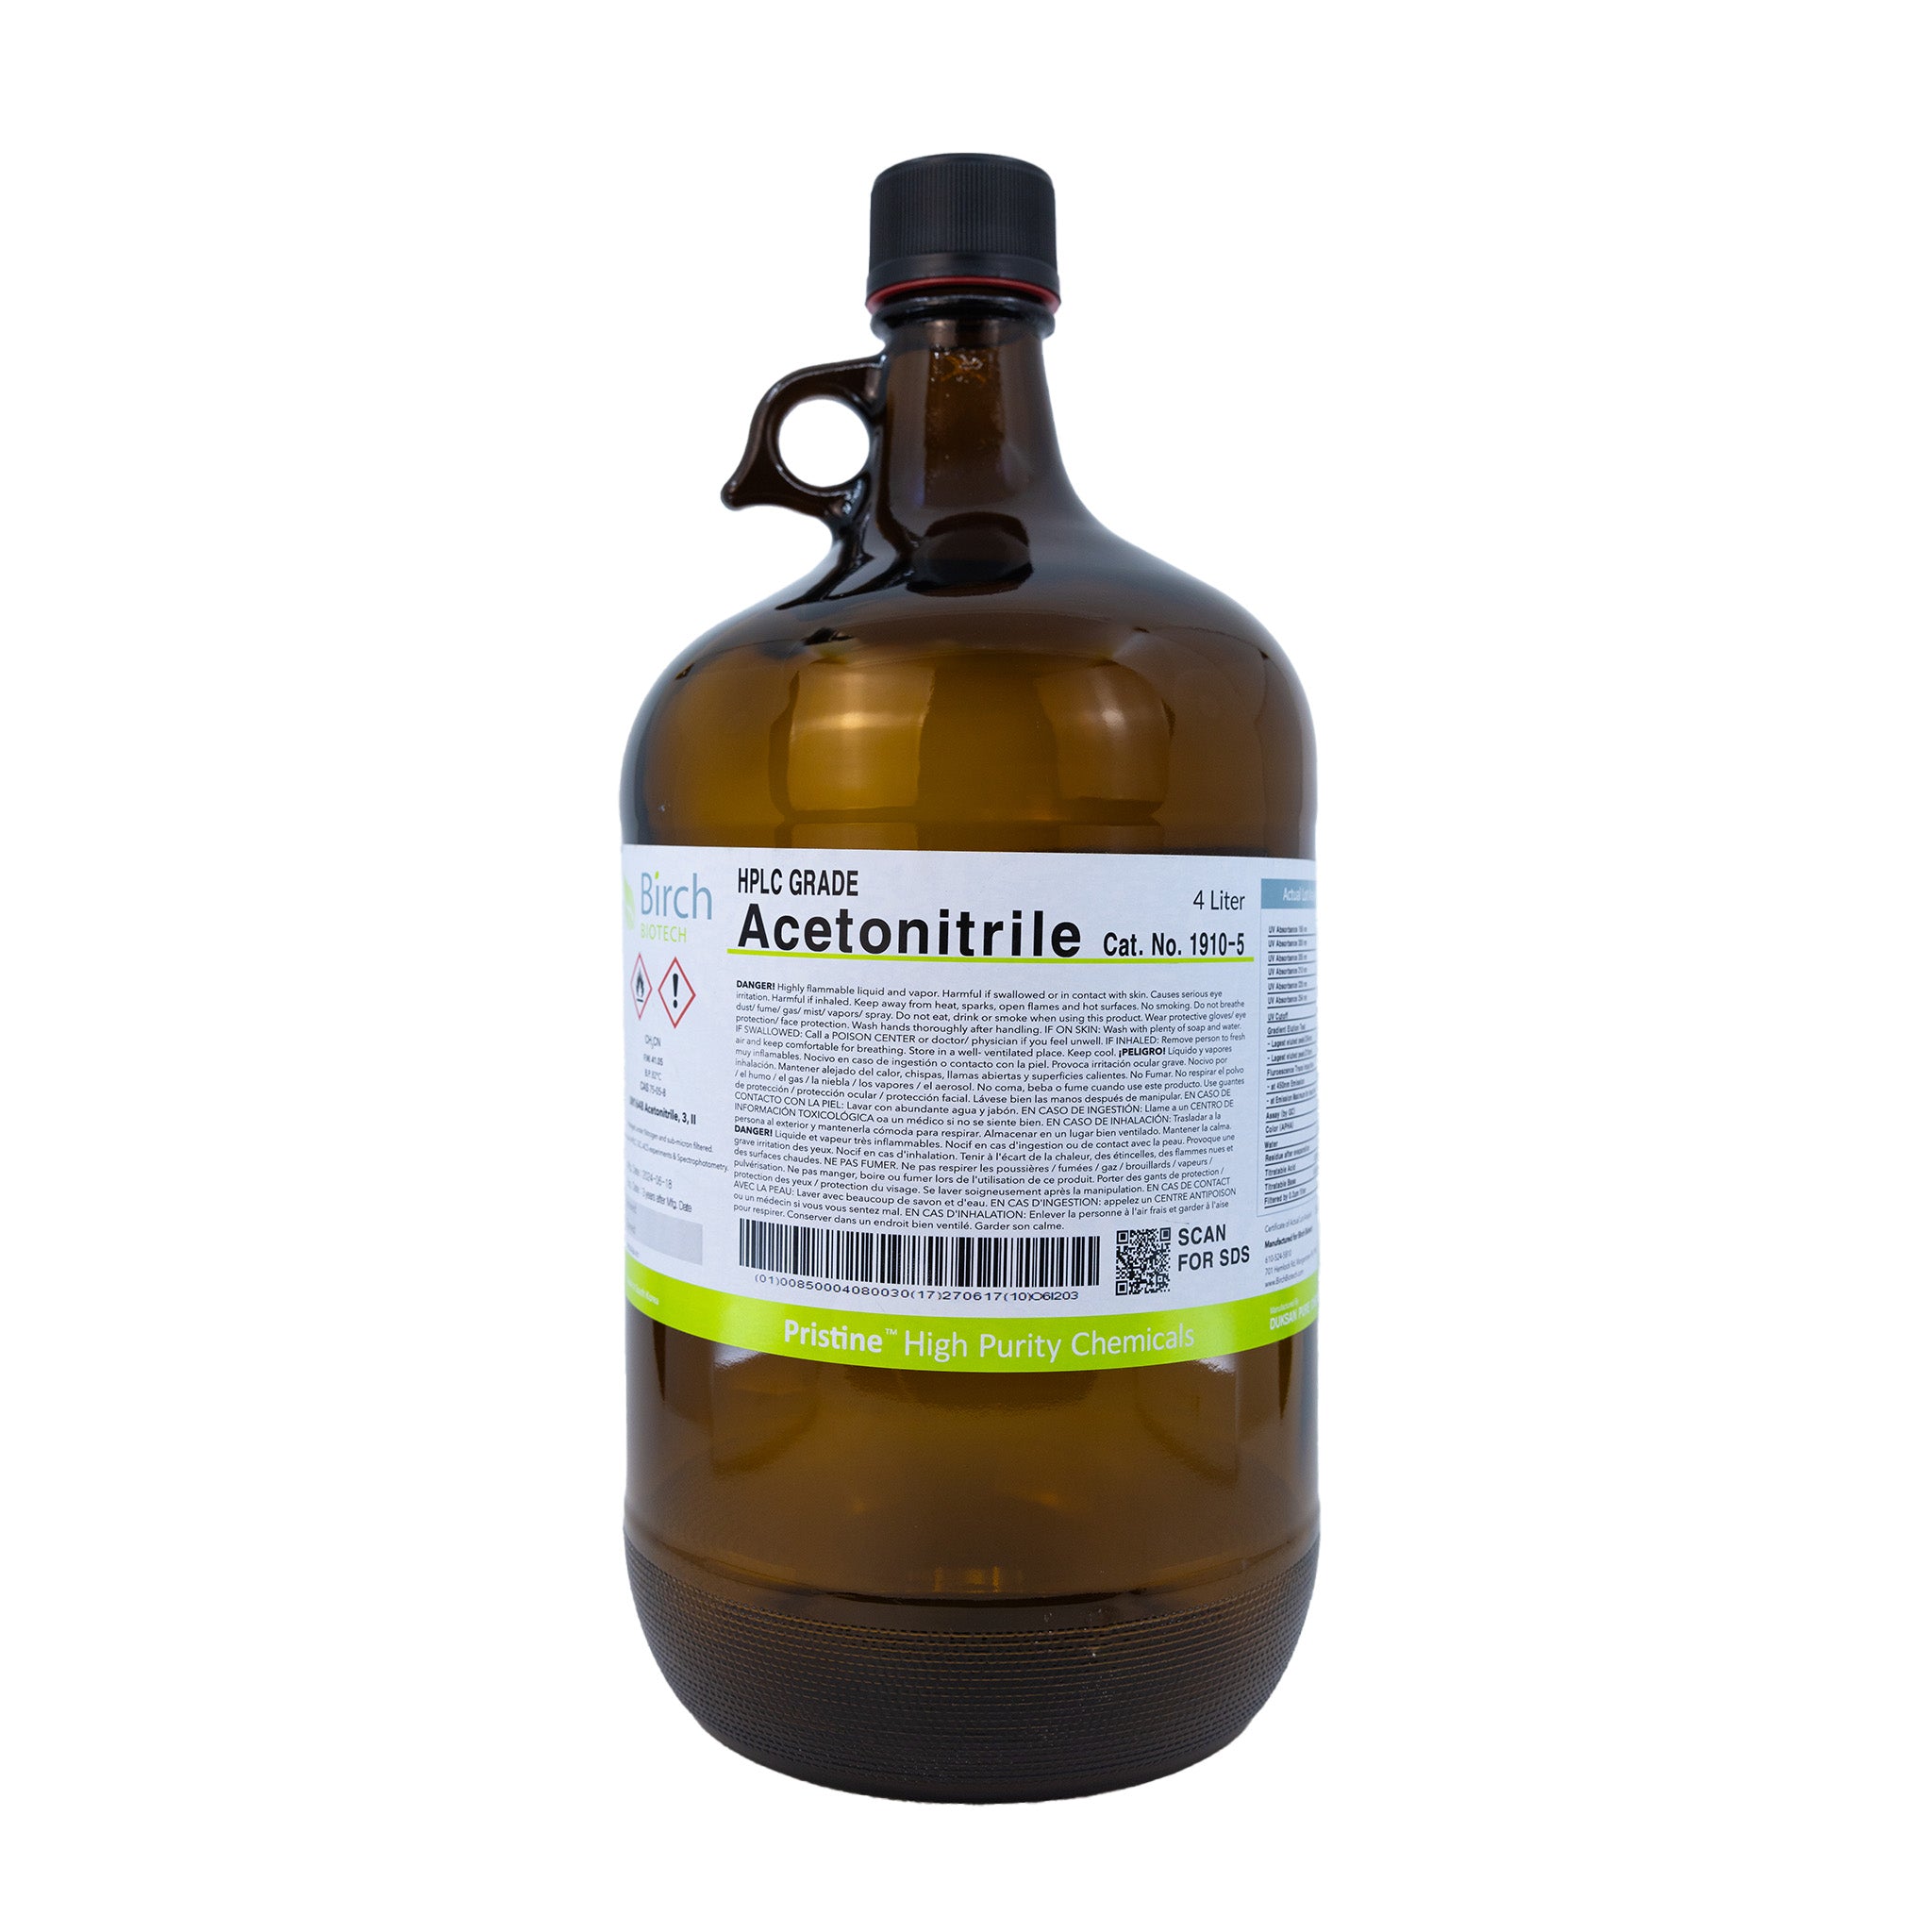
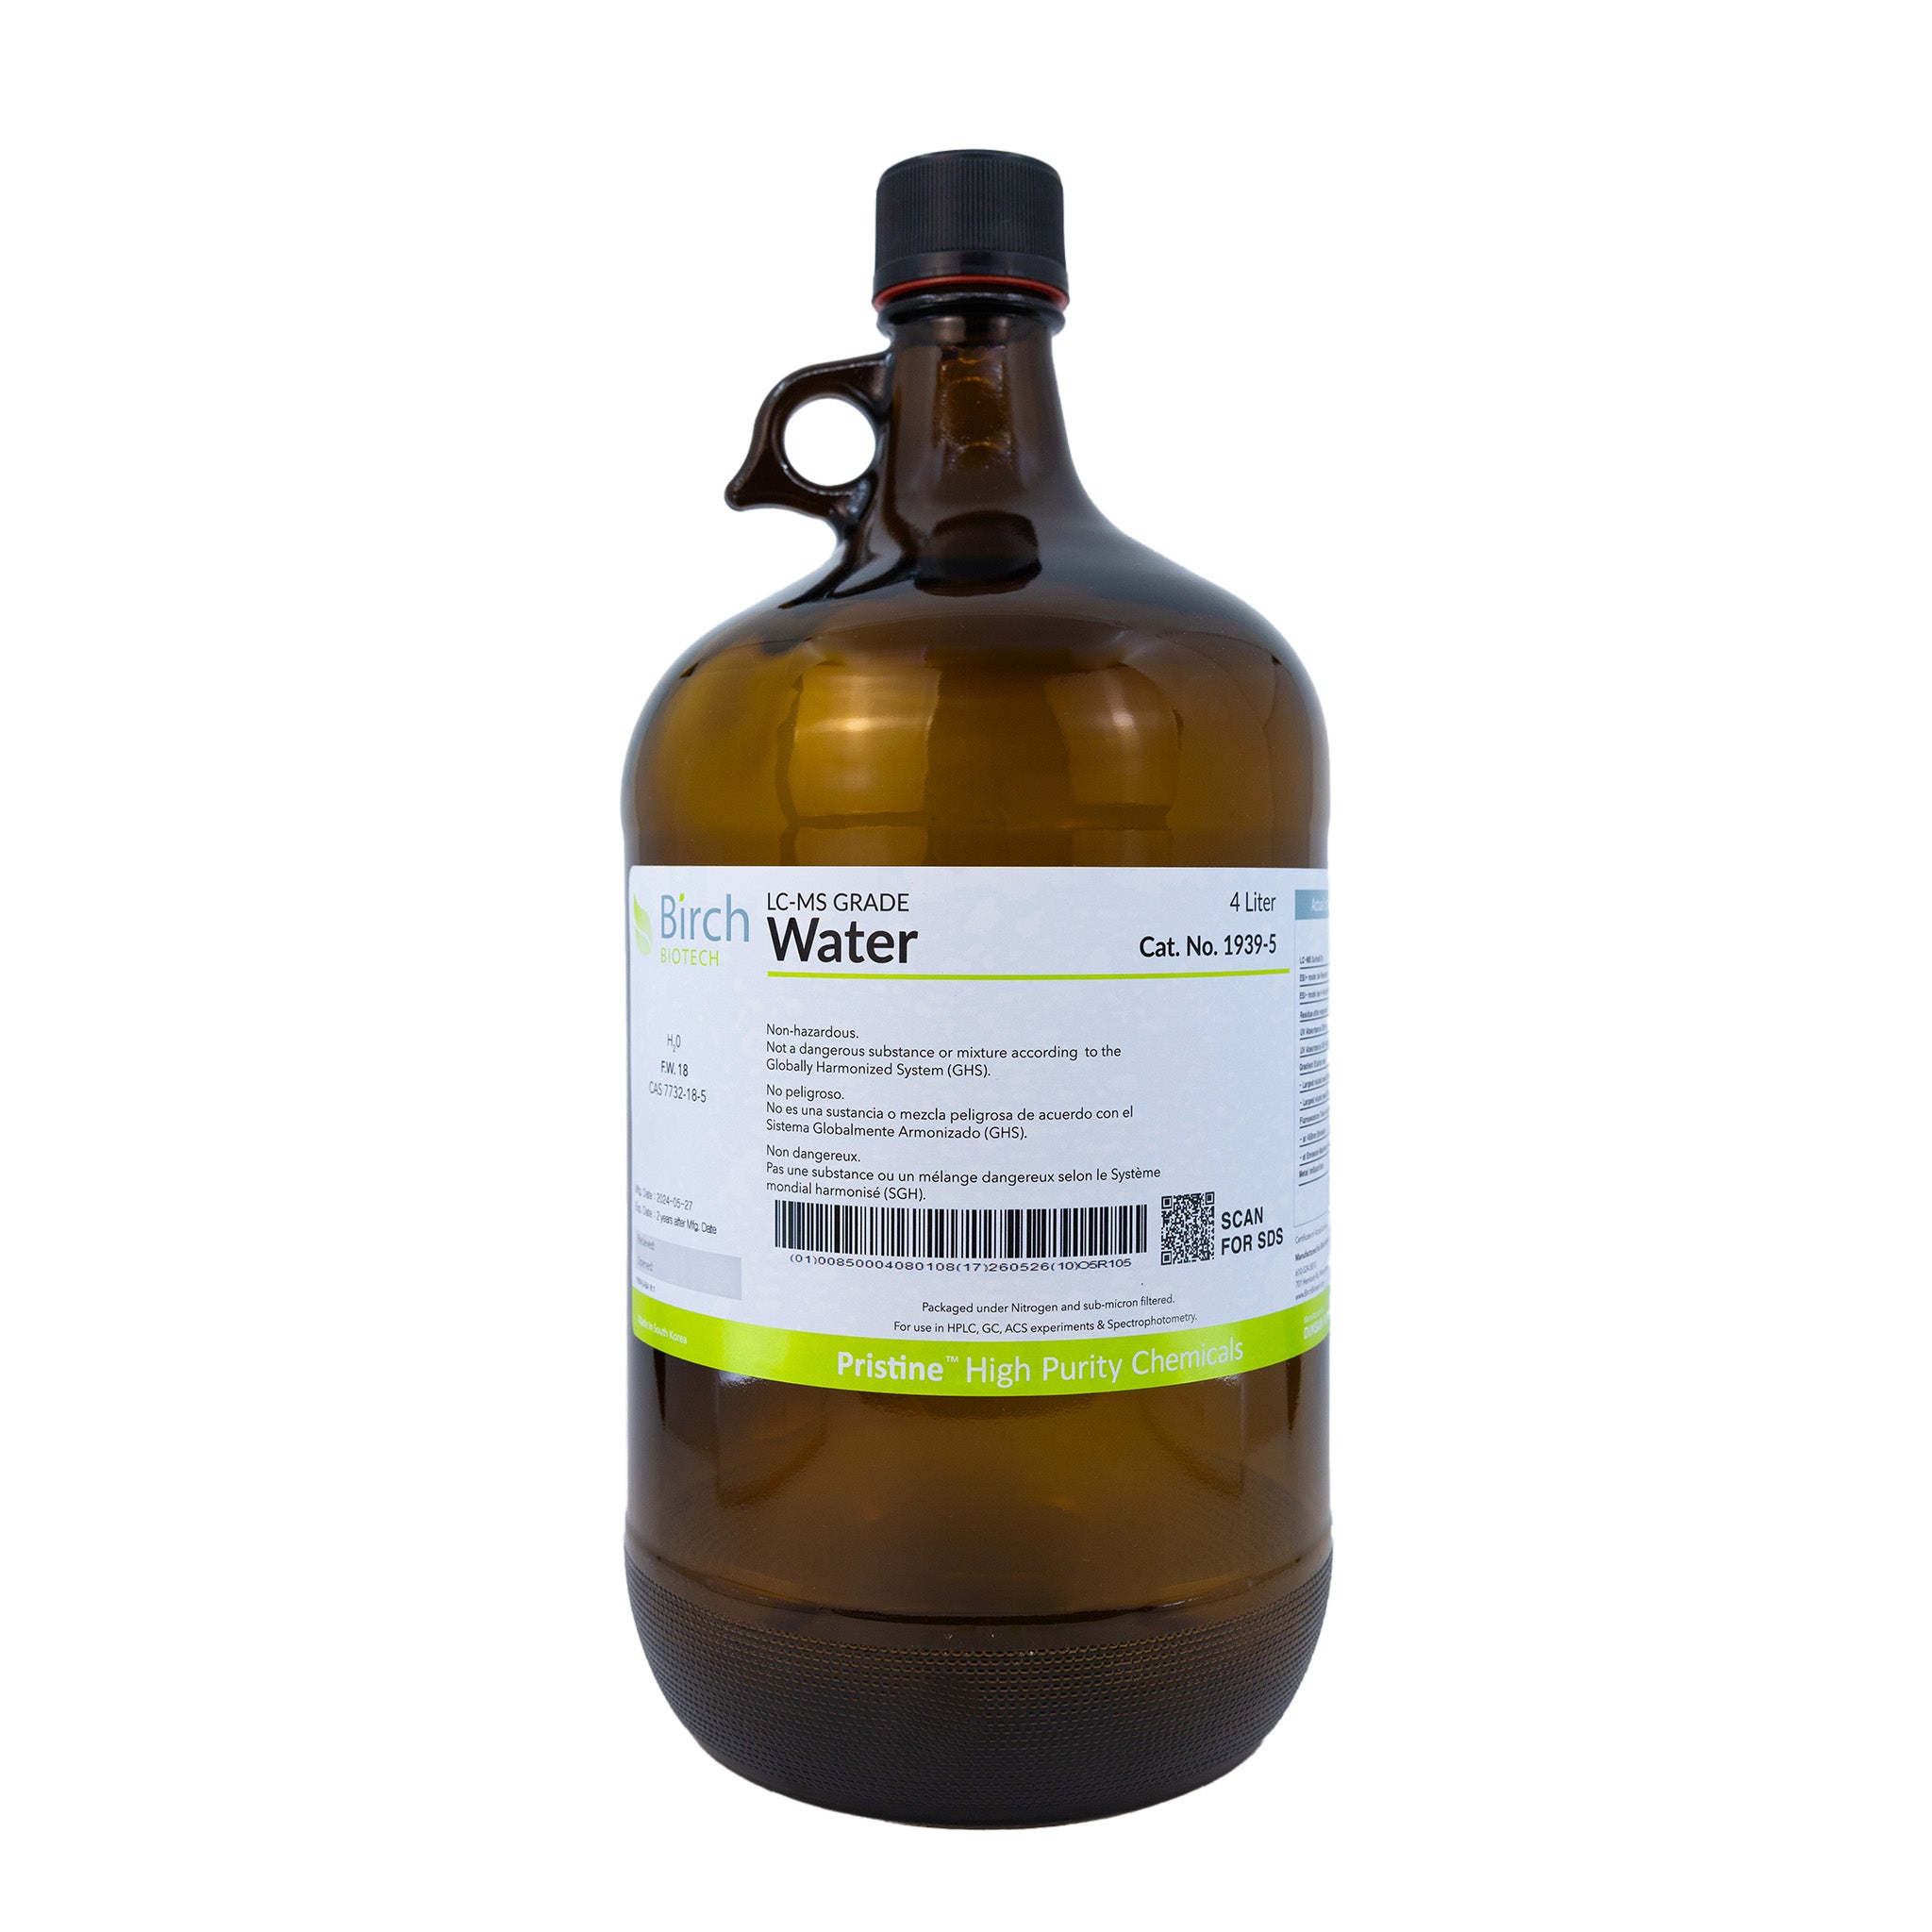
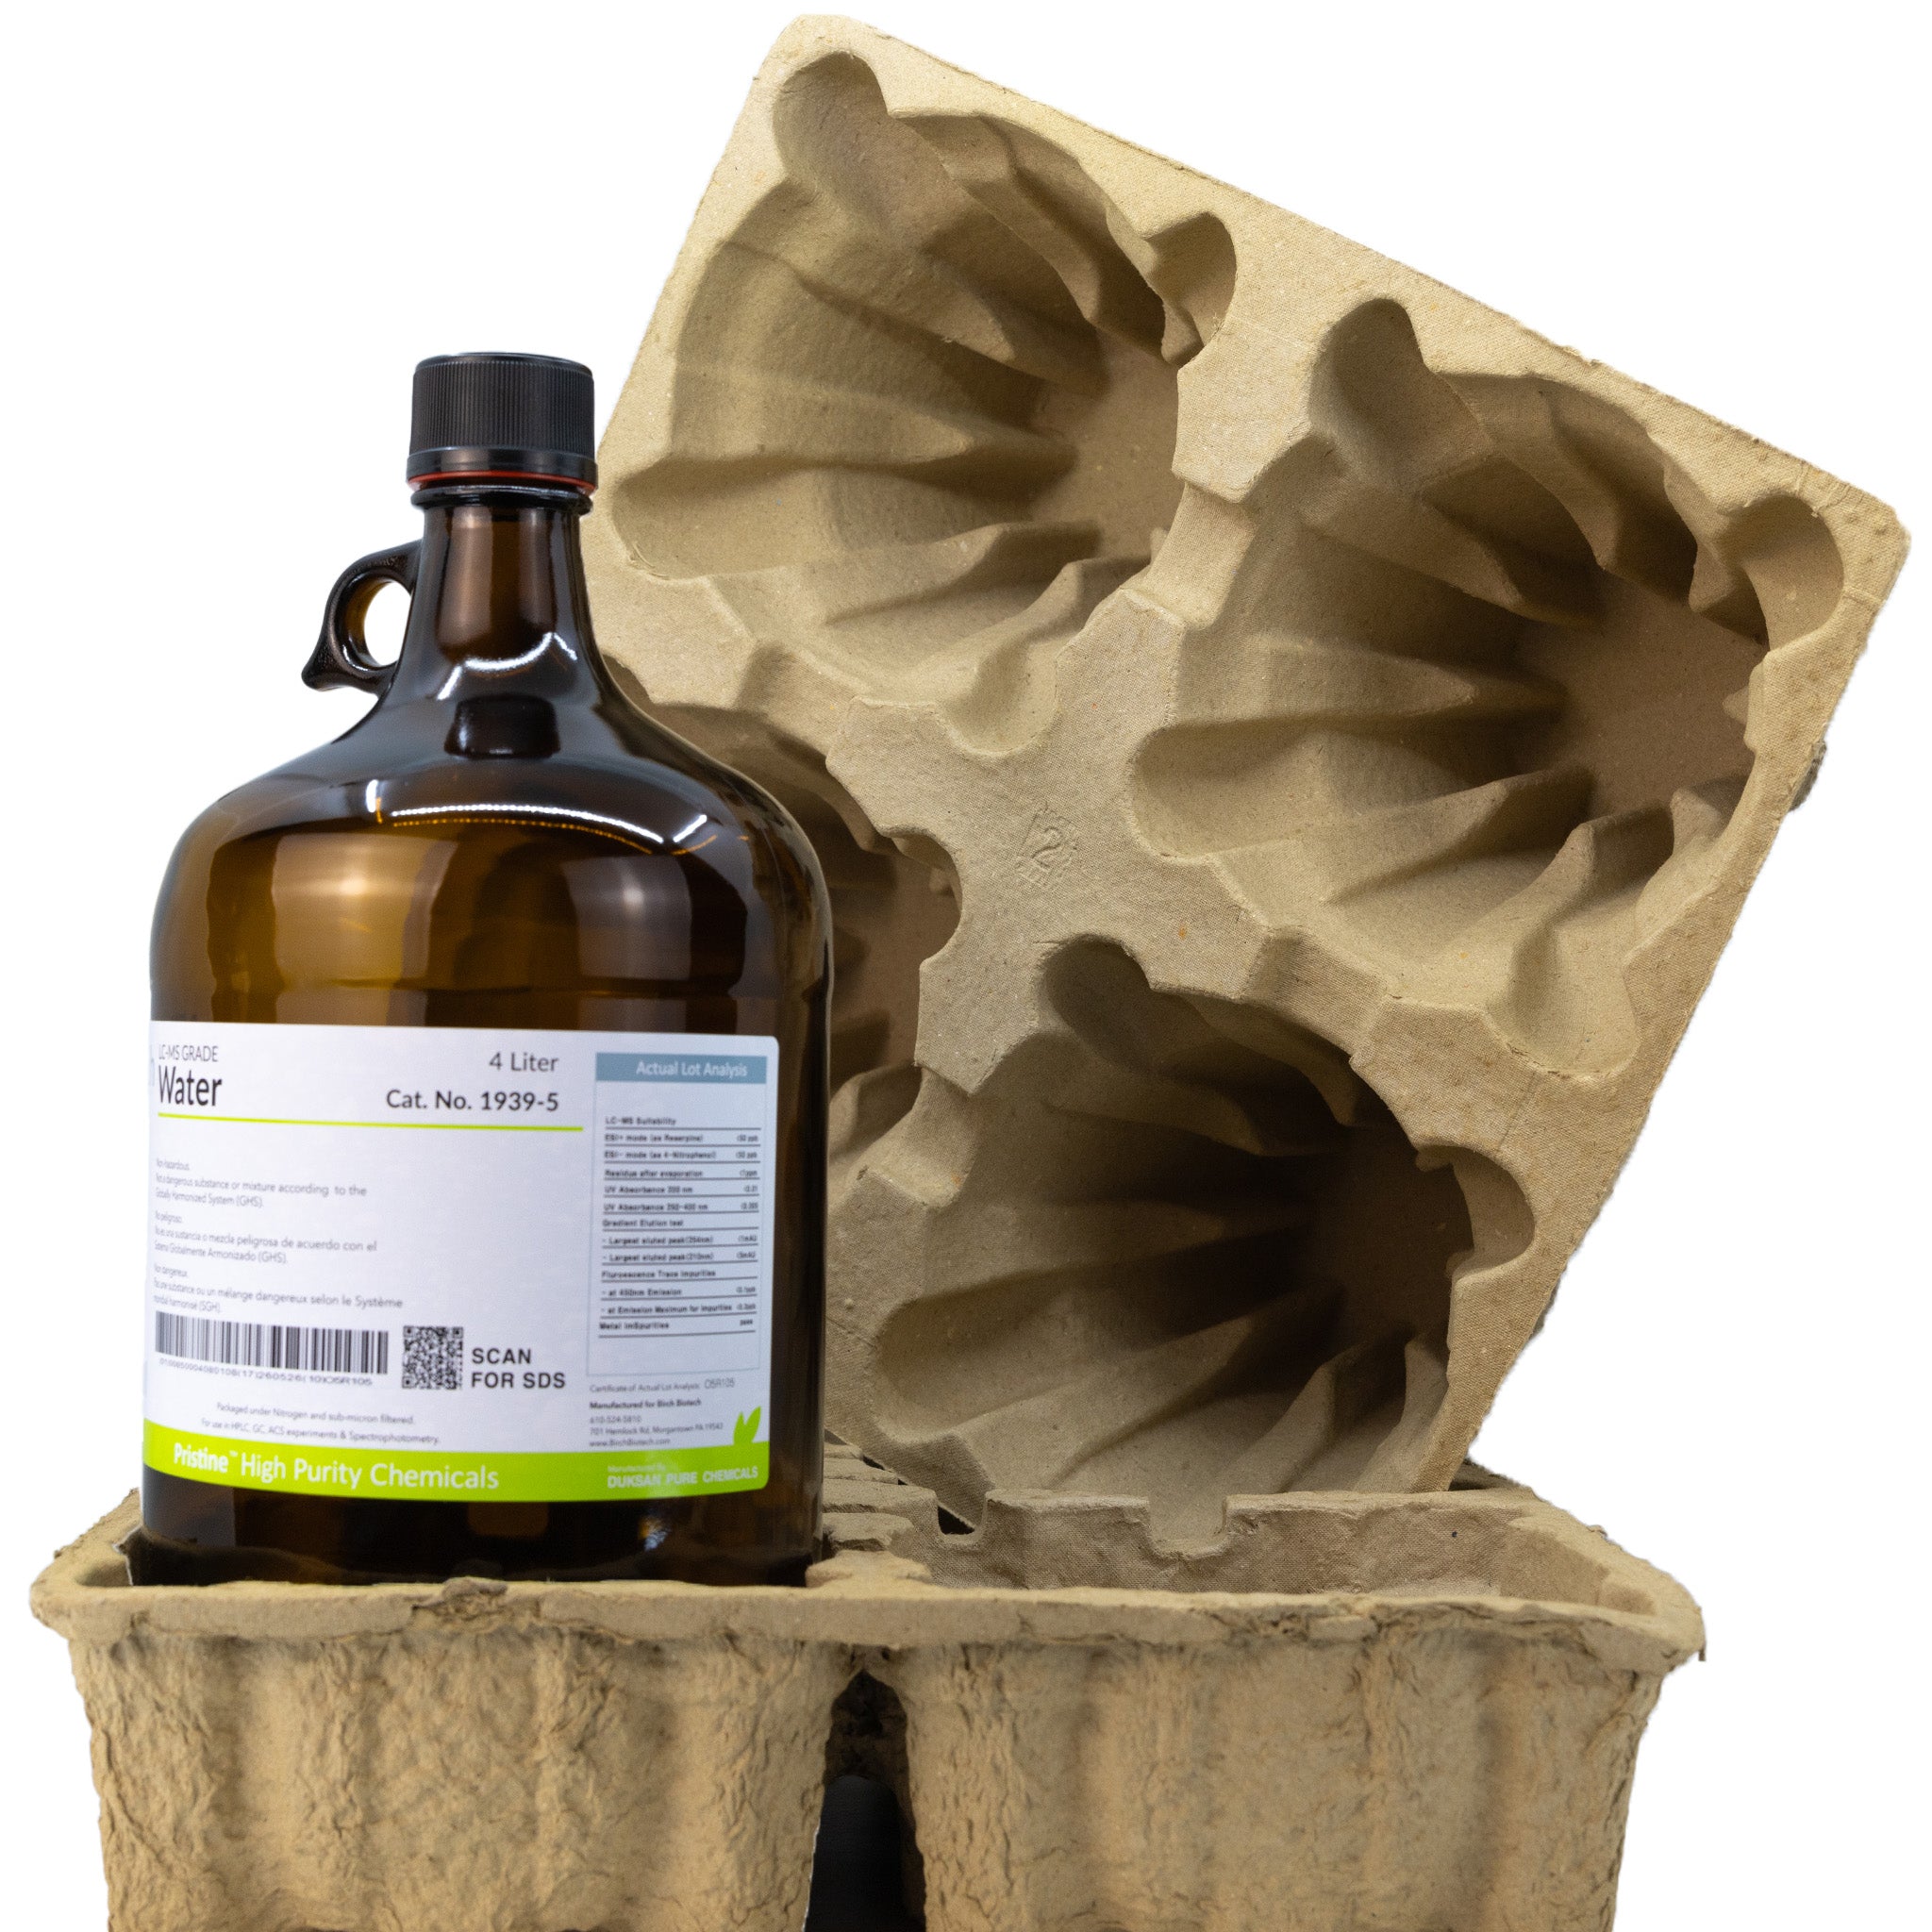
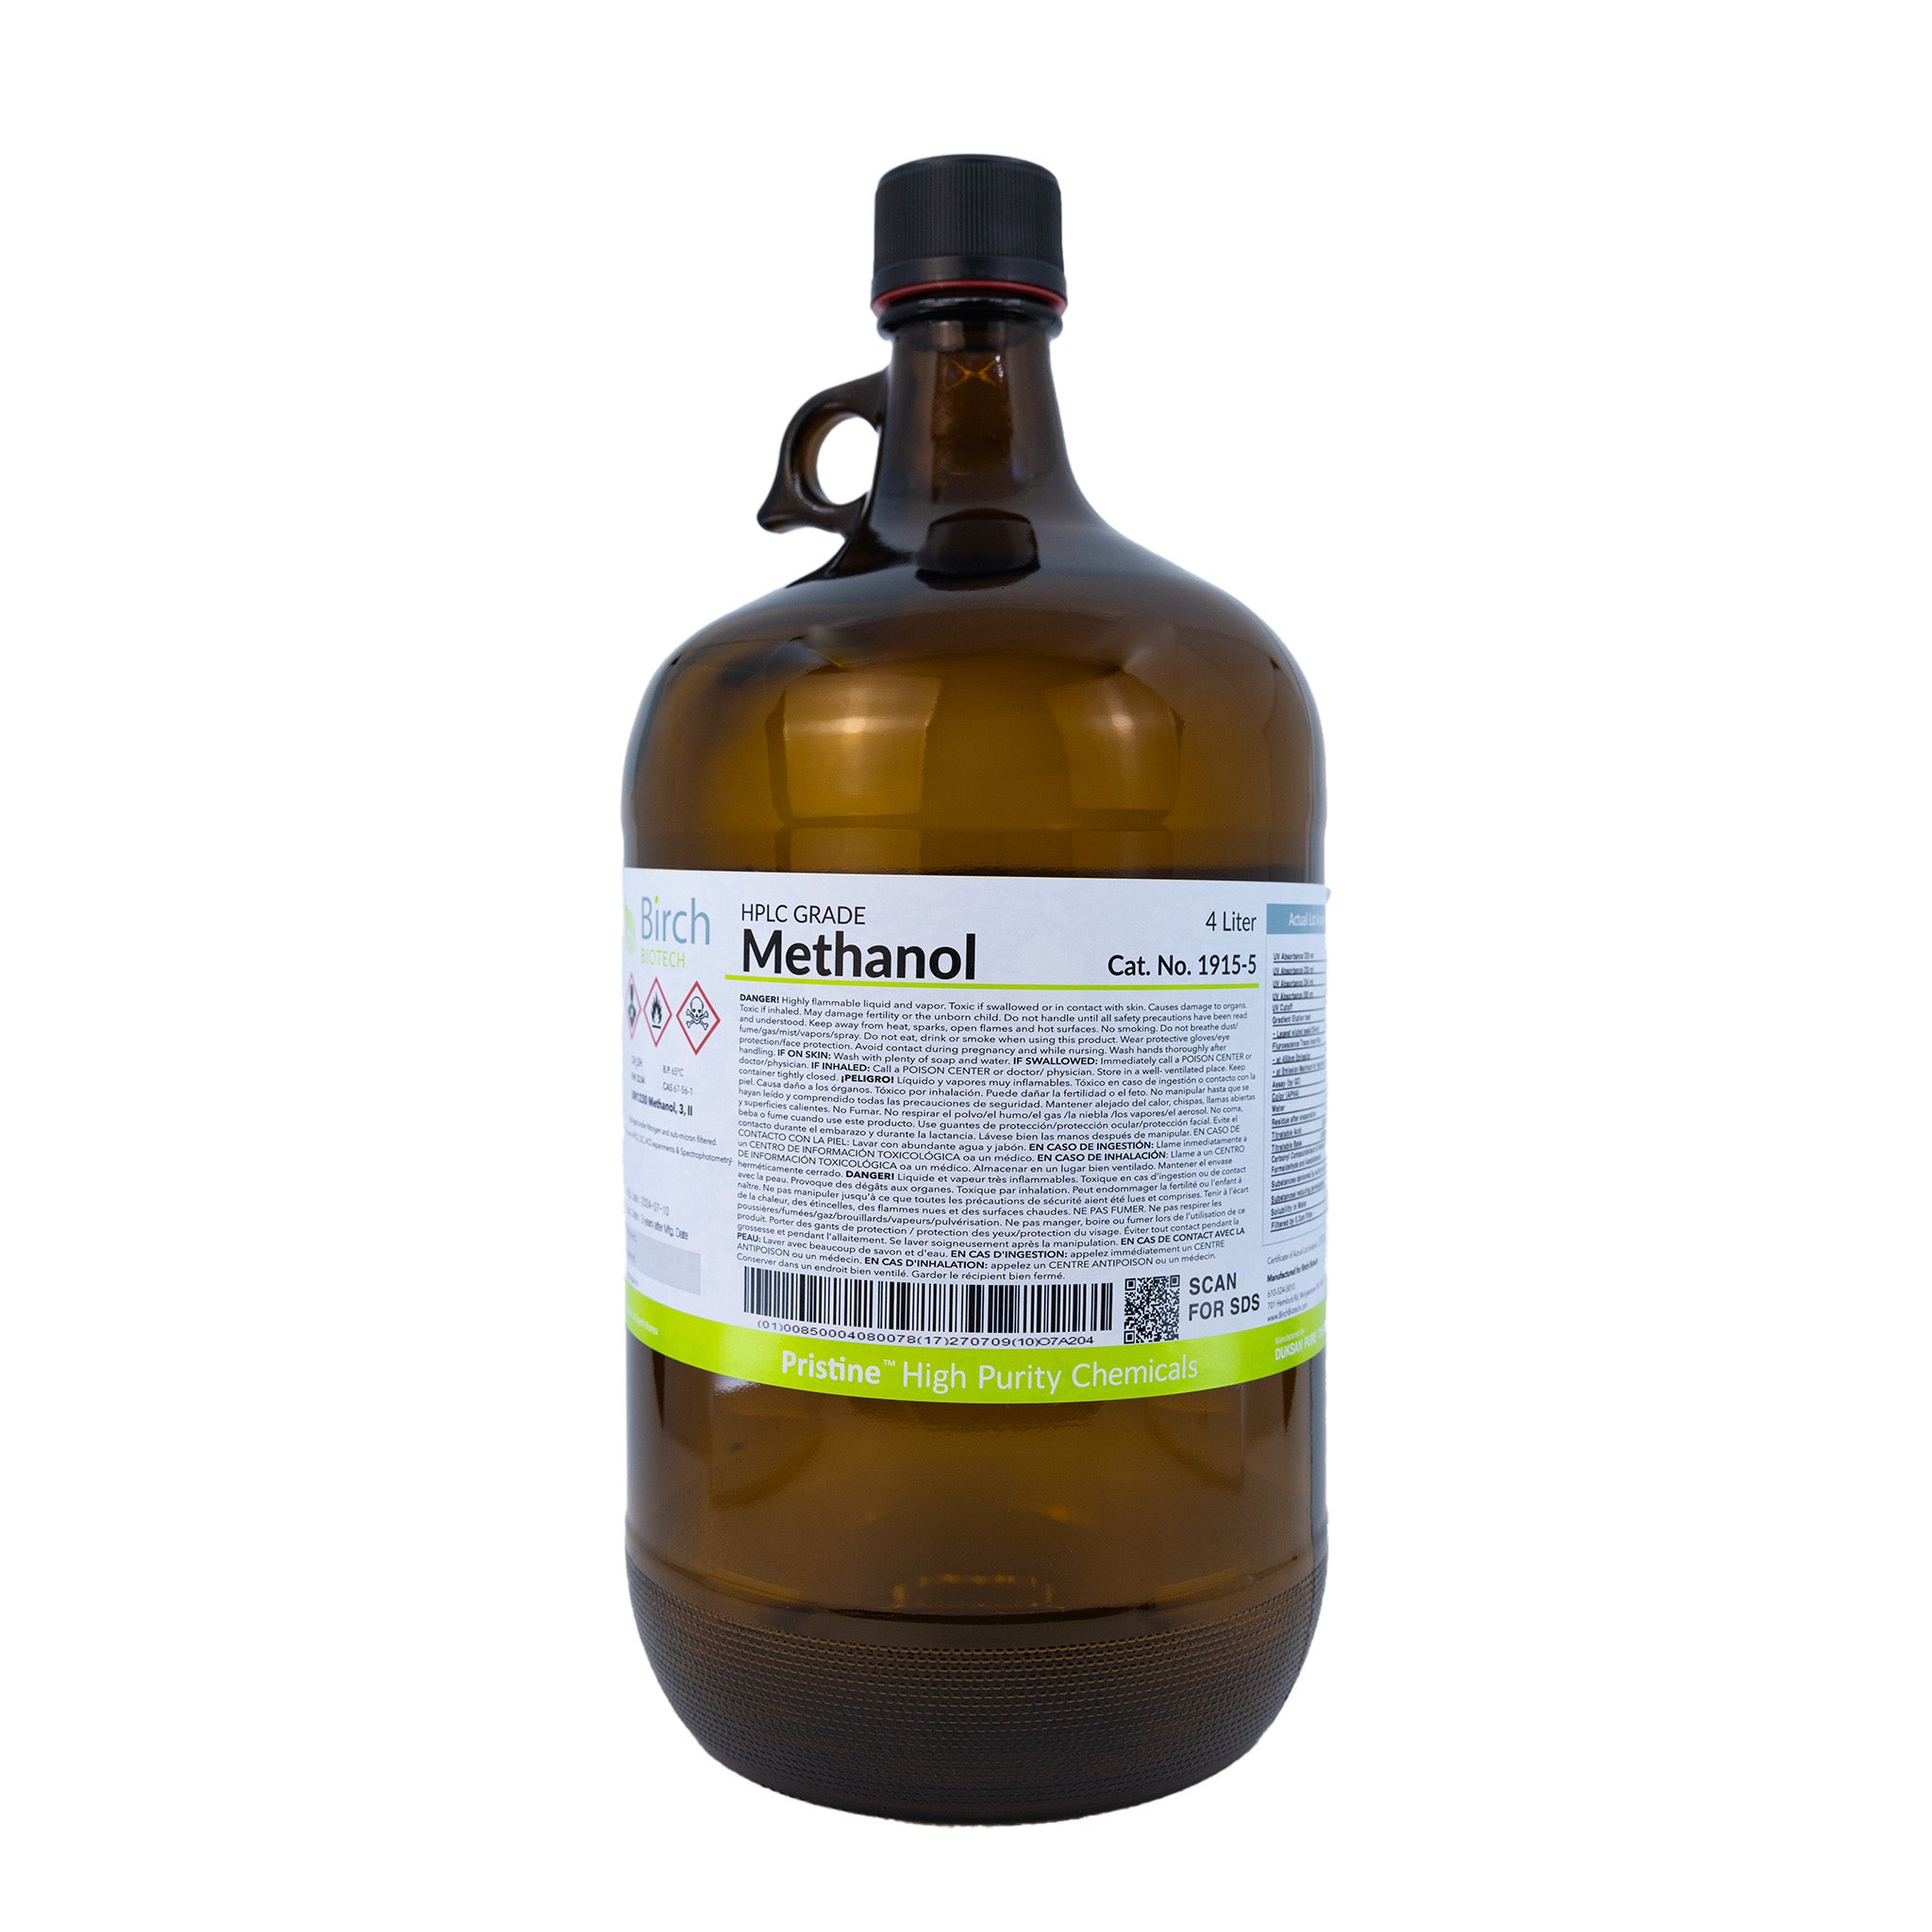
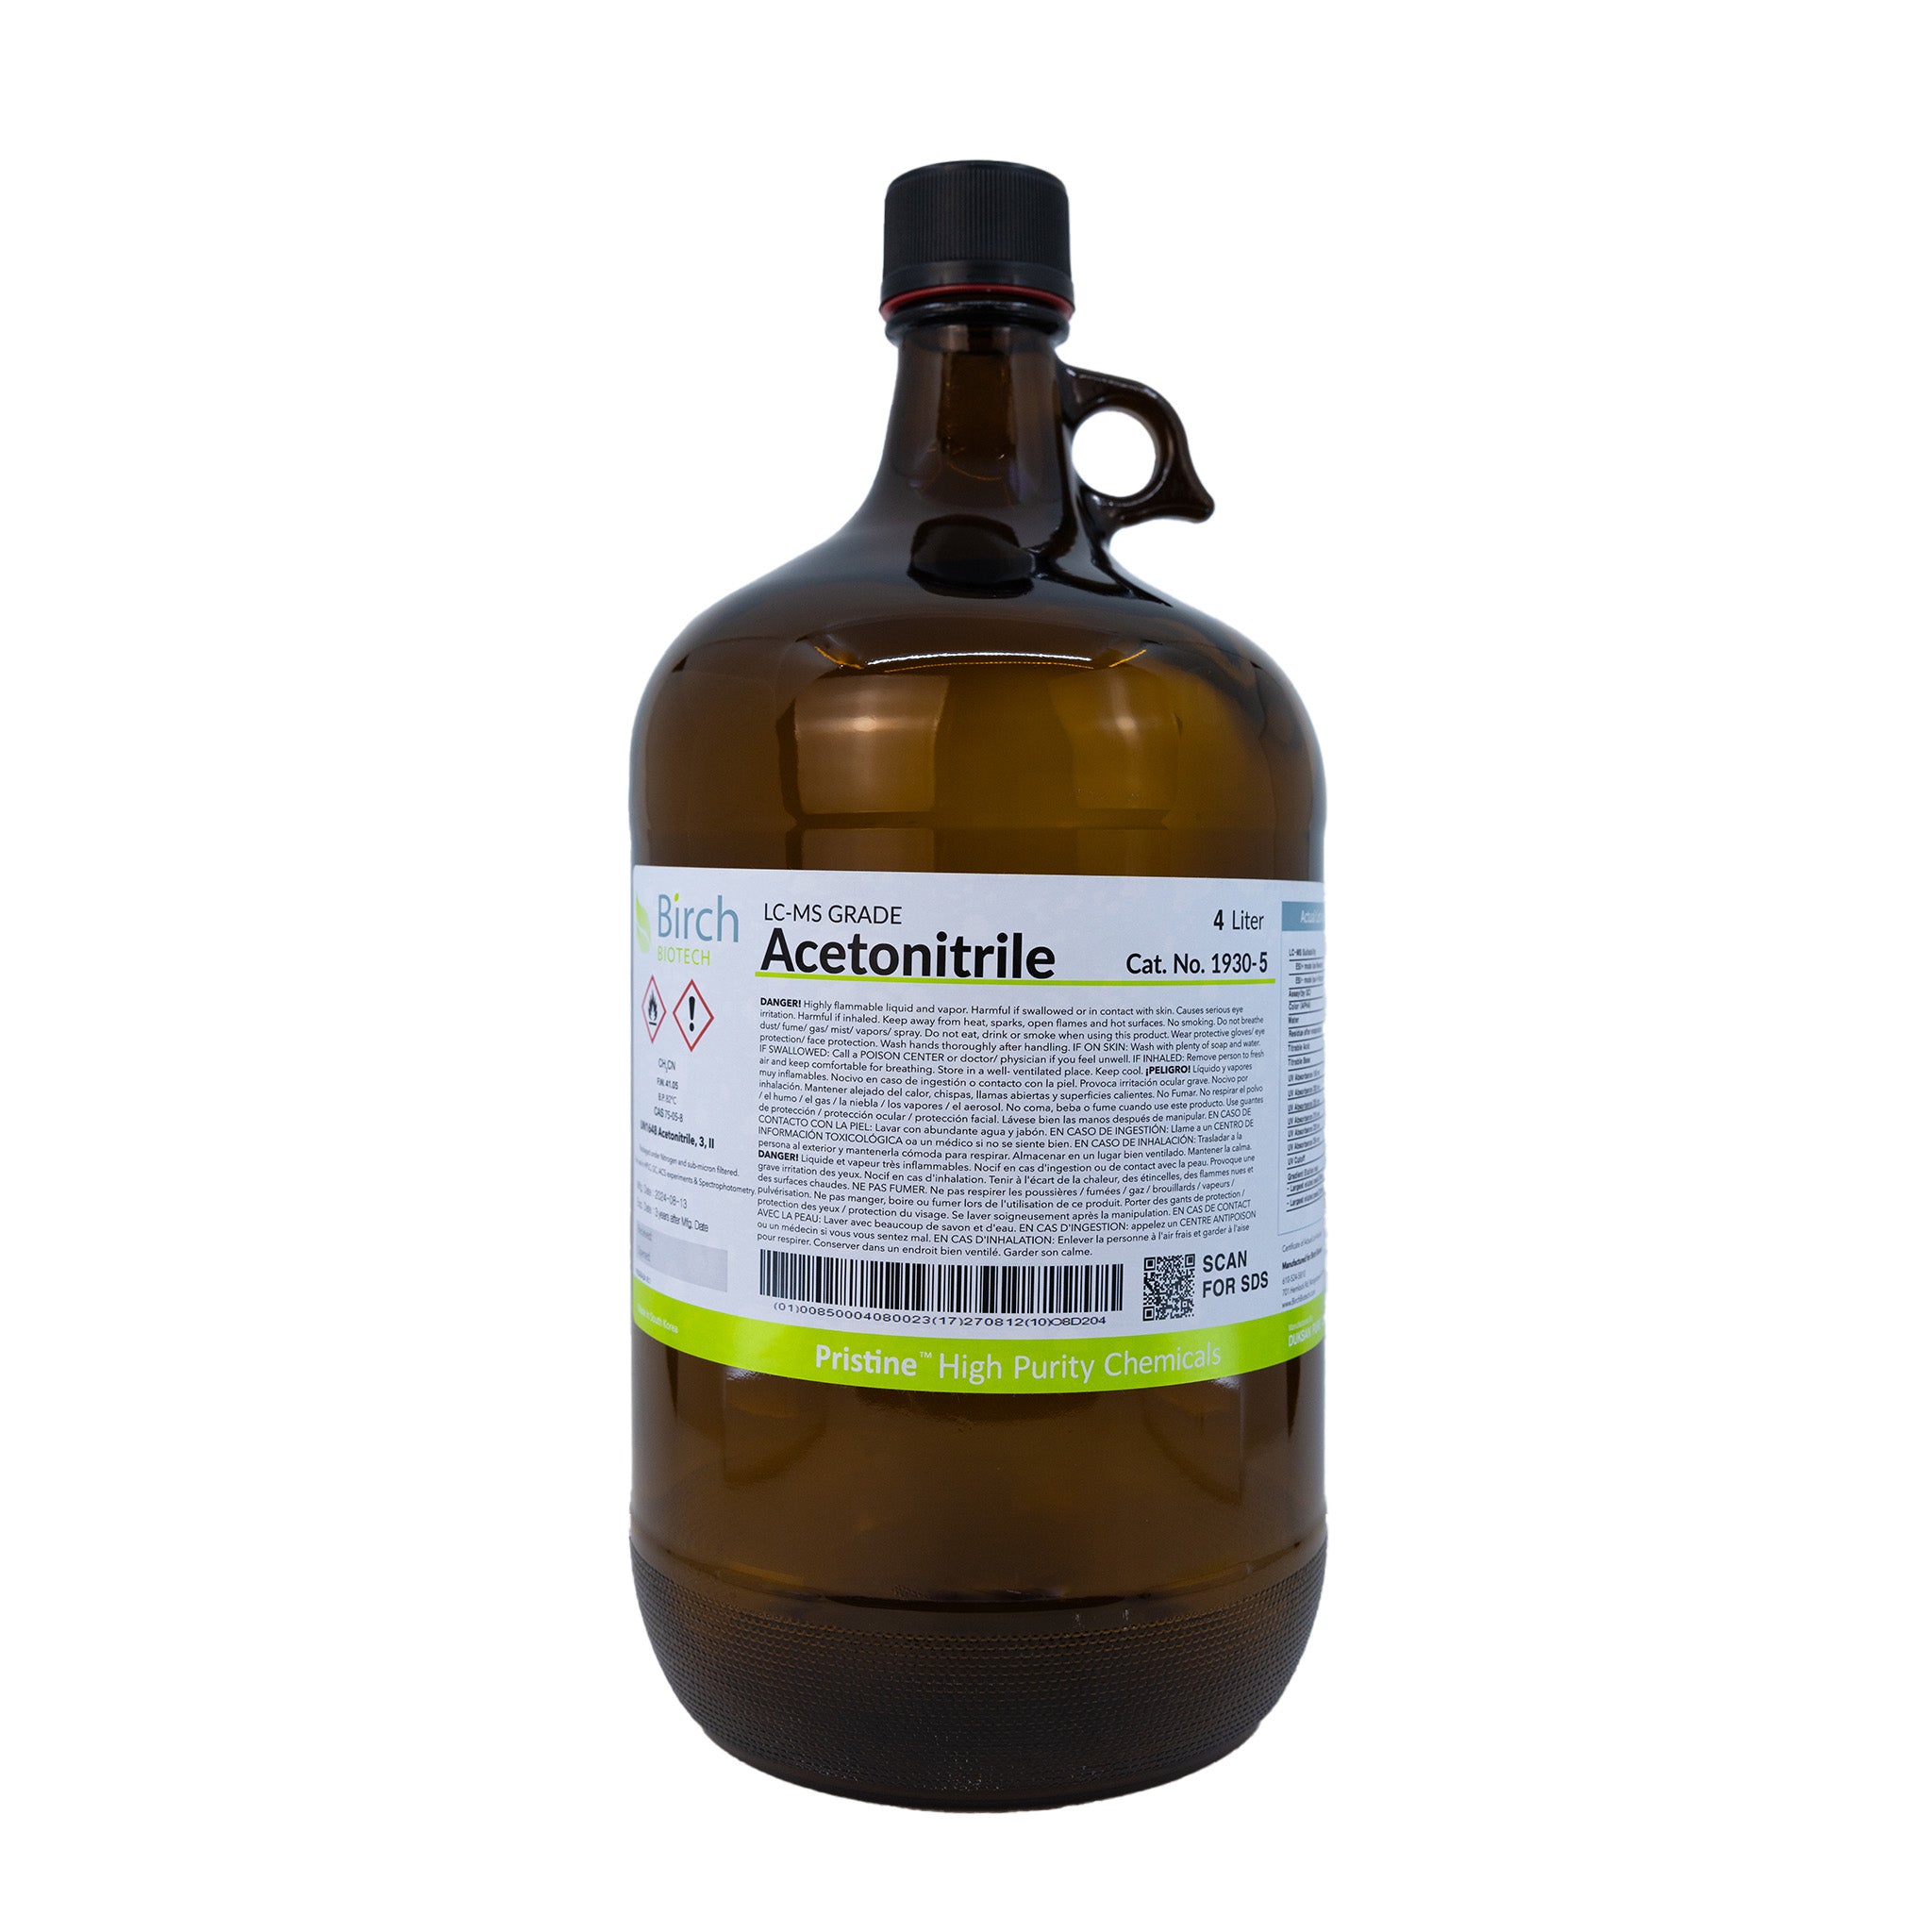
A significant challenge with maintaining LC-MS performance is preventing contamination, which can easily impact test reliability, cause equipment downtime, and possibly require expensive maintenance to fix. To avoid these adverse impacts, following purity guidelines with your solvents will ultimately minimize unanticipated problems within your LC-MS system that may produce misleading results. By focusing on strategies to prevent contamination, you can optimize your lab's efficiency and data accuracy. Effective solvent management begins with understanding the impurity risks associated with LC-MS systems. Solvent compatibility, purity grade, proper handling, purification techniques, equipment calibration, and regularly maintaining a sterilized lab environment are all necessities to avoid the repercussions of contaminants. Liquid Chromatography-Mass Spectrometry offers some of the most precise analytical tools that modern technology has available today, and with proper knowledge about solvents, your LC-MS analyses will yield more accurate, reliable results. LC-MS Contamination Sources and Impacts Contamination in LC-MS systems often leads to misleading results and reduced instrument efficiency. The ability to maintain accurate and reliable analyses depends on comprehending the technology, chemical interactions, and detection of possible contamination sources ahead of time. Sample integrity remains intact during an LC-MS analysis when researchers create strict environmental controls and follow purity grades. By controlling lab conditions with regular maintenance, airborne contaminants, microbials, and particulate interference can be suppressed for system efficiency and longevity. Sources of Contamination in LC-MS Contamination in LC-MS systems primarily stems from solvents, tubing, and system components. Solvents not specifically graded for LC-MS can introduce high background signals, which interfere with signal interpretation even on the parts-per-billion (ppb) level. Improper handling and transfer of solvents can quickly introduce enough impurities to compromise results, even from airborne particles. For these reasons, filtering solvents can help prevent contaminants from accumulating over time, especially mixing processes with the mobile phase or other additives. Other contamination sources include traces from previous samples, carryover in the system, and degraded components like seals and gaskets. Regular maintenance helps in reducing these risks, such as routine checks for worn parts and flushing a system with solvents that are compatible with the stationary phase and residual analytes. LC-MS grade acetonitrile is a common choice for flushing, given its purity and chemical cleaning properties. Lab Air Quality Control Airborne contaminants, such as particulate matter and volatile organic compounds, are easily overlooked and can cause peak suppression in a final analysis. They affect non-testing tasks, like transferring containers and long-term storage. To minimize airborne particles, consistent air conditions in a lab should be maintained and monitored, including a stable temperature and humidity in an acceptable suitable for your solvents, samples, and other testing equipment. Implement a cleanroom-like environment where air pressure and airflow are regulated with ventilation systems and high-efficiency particulate air (HEPA) filters. These standards will create a controlled setting for testing and prevent sample degradation. Preventing Microbial and Particulate Contamination Microbial growth in a laboratory can severely affect sample integrity and testing performance. Stringent cleaning protocols with disinfectants that are within purity guidelines are a proven way to prevent the accumulation of microbes on work surfaces and equipment. For particulate contamination, maintaining a clutter-free workspace where materials are properly stored can help reduce risks. Consider using cleanroom garments and only in-lab accessories to reduce personal contamination that may enter a lab setting. Regular checks and maintenance of HVAC systems further contribute to maintaining a contaminant-free environment. Solvent Grade and Selection When selecting solvents for LC-MS, it is imperative to opt for a purity with at least an LC-MS grade. These meet stringent purity standards with minimal metal content, organic carbon, and other contaminants that could interfere with results. They also consider factors like conductivity, where lower conductivity indicates fewer ionic impurities. Although some higher grades can be suited for LC-MS, like ACS (American Chemical Society) Grade and Reagent grade, these choices tend to be less economical or practical compared to grades tailored for LC-MS applications. During the purchasing process, make sure to check your seller’s product specifications and manufacturing certifications to guarantee your selection matches your testing grade with reliable standards. Contamination Prevention and Maintenance Acknowledging contamination impacts and sources is the first step toward preventing unexpected hindrances within your LC-MS system. The following tips and techniques can help assure your lab that these conditions are controlled and maintained both during tests and for long-term accommodations. Mixing and Preparing Mobile Phases To prepare your solvents, maintain a strict protocol for using LC-MS grade products that interact with an analysis, including cleaning treatments for glassware, mixtures, and buffers. Mix solvents in a clean environment to avoid introducing impurities. Rinse bottles with only LC-MS grade solvents like isopropyl alcohol before use to remove residual contaminants. Glass bottles are generally used to store solvents, as they minimize interaction with container materials and preserve purity. Amber glass is often used for solvents like dichloromethane and acetonitrile that may create adverse reactions to sunlight during storage. Only use ultra-pure water for aqueous mobile phases. Consider using LC/MS-grade bottled water[1] or LC-MS grade water available with us at Birch Biotech. Always verify that solvents are made under robust quality control processes, and refer to detailed quality documentation provided by the manufacturer for confirmation. Purification and Filtration Methods Effective purification and filtration can address potential contaminants. Filtering solvents through 0.2-micron or smaller filters removes particulate matter, which might otherwise clog instrument components or interfere with analyses. Preventative maintenance includes regular cleaning of solvent lines to counteract issues such as microbial growth. Reverse osmosis is commonly used to produce high-purity water, which helps prevent interference from contaminants. Other purification techniques, like distillation, assure comprehensive results by removing various impurities. When using mobile phases containing additives, a thorough flush with high-purity water or organic solvents that follow standard cleaning guidelines[2] helps guarantee contaminants are minimized. Solvent Transferring and Storage When transferring solvents, always use dedicated equipment like pipettes or dispensers to prevent cross-contamination in a lab controlled environment. Constantly repeat cleaning steps in between their uses. Store solvents in well-sealed containers away from direct sunlight to prevent degradation. Proper storage also involves monitoring conditions like temperature and humidity. Solvent reservoirs should be covered to minimize exposure to the air, which can introduce contaminants. Implement a clear labeling system for mobile phase bottles correct handling and to minimize errors. Cleaning Routines Proper cleaning is a quintessential task for contamination prevention and optimizing LC-MS analysis. To maintain cleanliness, regularly scrub LC-MS vials and rinse all washed glassware thoroughly. Use desalting liquid-liquid extraction methods for efficient sample cleanup. Consider performing a wet prime by flushing your system with water followed by an organic solvent in order to eliminate residual additives. As mentioned other times earlier in this article, only suitable LC-MS grade cleaning supplies should be applied to uphold the purification standards necessary for optimal LC-MS performance. Frequently switch to fresh, clean solvents to minimize any accumulation of contaminants. Instrument Calibration Regular calibration can help guarantee that all LC-MS instruments perform correctly and that detectors accurately analyze mass-to-charge ratios. This will optimize your mass spectrometer, chromatography machinery, ion source, transmission equipment, and other key components of your LC-MS system. Improperly calibrated instruments can lead to inaccurate readings and compromised data quality, so reference your equipment manuals and guidelines for particular action items, techniques, and instructions. Regular Maintenance Regular maintenance not only extends the lifespan of your equipment but also improves the accuracy of your results. Regularly service your vacuum pump, which is typically recommended to change the oil and filters every six months. Consider implementing a shutdown method to maintain your system’s integrity when the equipment is idle. Keep N₂ flowing through your mass spectrometer source to prevent contamination buildup and protect instrumentation. Always use your LC-MS equipment guidelines for recommended maintenance, which can vary based on the products you purchase. References: [1] Top 10 things users can do to minimize contamination of LC/MS systems. (n.d.). https://sciex.com/support/knowledge-base-articles/the-top-10-things-users-can-do-to-minimize-contamination_en_us [2] Waters. (2015). Controlling contamination in UltraPerformance LC/MS and HPLC/MS systems. https://www.waters.com/webassets/cms/support/docs/715001307d_cntrl_cntm.pdf

Solvent Selection for Mass Spectrometry: Key Considerations
Selecting a solvent for mass spectrometry impacts the quality of your operation and the choice of components best suited for your testing goals. Aligning solvent properties with these factors will balance your sample and mass spec techniques in a strategic way that will improve the accuracy of your results. Solvent Compatibility with Mass Spec To choose an appropriate solvent for an analysis, certain criteria change depending on your instrumentation and ionization technique. Mass spectrometers revolve around the relationships between a molecular ion source, a mass analyzer, and a detector. Sample molecules are converted into ions and separated with an analyzer based on their mass-to-charge ratio before a detector measures the relative abundance of each ion upon a spectrum. Different MS methods like quadrupole, time-of-flight, and magnetic sector analysis can require different solvents, ionization strategies, and other spectrometry equipment. For these reasons, solvents are chosen based on their compatibility with different ionization techniques. There are several to consider with electron ionization and electrospray ionization known for being versatile choices: Electron ionization (EI) is a common method that involves bombarding a sample with high-energy electrons to ionize and fragment the compounds. Electrospray ionization (ESI) uses a high-voltage electric field to ionize the sample and produce fine droplets that evaporate and release ions. Chemical Ionization (CI) introduces an analyte through a chamber where a reagent gas like methanol facilitate ionization, forming plasma. Field Ionization/Desorption are both techniques with principles centered around the quantum tunneling of of electrons, which generate the cation and generates a high potential gradient. Matrix Assisted Laser Desorption Ionization (MALDI) uses a pulsed laser to desorb molecules and generate singly charged ions and volatilize analytes with extremely high molecular weights. Inductively Coupled Plasma Mass Spectrometry (ICP-MS) uses a plasma torch and electromagnetic induction at high temperatures, which break down analytes into constituent elements. High-purity solvents act as a carrier for mass spectrometry and other tandem techniques, especially liquid chromatography. They dissolve samples into a mobile phase to traverse the stationary phase, mass analyzer, and detector. With ionization at the core concept of mass spectrometry, specific solvent properties become detrimental attributes for compatibility with your mass spectrometer. Solvent Selection Criteria Several different solvent properties play into your selection criteria for your mass spec analysis. Even with advanced technology, selecting the wrong solvent can undermine your analytical results. In order to match their compatibility with proper ionization techniques, consider the key factors below for your selection. Purity Grade The efficiency of your mass spectrometer largely depends on the purity of a solvent. Contaminants often meddle with analyzers and detectors, ultimately creating misleading or compromising results. Given the precision mass spec offers, purity grade can matter even at the parts-per-billion level. Some solvents are manufactured in ISO9001 facilities in order to standardize purity expectations, guarantee quality, and create batch-to-batch consistency. At Birch Biotech, we offer a selection of LC-MS grade solvents best suited for liquid-chromatography mass spectrometry. Polarity and Solubility A solvent's polarity plays a direct role in the ability to dissolve a sample, directly influencing separation efficiency. Matching solvent polarity with the analyte creates the proper solubility needed for high-quality spectra. Different polarity characteristics change how samples may dissolve into a mobile phase or interact with other stationary phase properties. Most solvents are classified into two polarity categories: Protic solvents: methanol and water mixtures, often used due to their ability to donate protons, aiding in positive ionization methods. Aprotic solvents: acetonitrile is popular for its low viscosity and high volatility, making it ideal for nebulization and evaporation in techniques like ESI. The choice depends on whether your target compounds are more soluble in polar or nonpolar environments, which directly affects retention and resolution during analysis. Polar solvents like water can dissolve ionic and polar compounds, enhancing peak resolutions. Conversely, nonpolar solvents like hexane allow for the separation of nonpolar substances. Chemical Compatibility Chemical compatibility assures that a solvent does not react with an analyte or instrumental materials in adverse ways. Several chemicals, such as acetonitrile and dichloromethane, have hazardous properties that may create dangerous reactions if not premeditated. Solvents must be inert to minimize unwanted interactions that could alter the sample or damage equipment, such as clogging or corrosion. Be aware of all solvents' reactivity and interaction with charged analytes, as these can impact ionization efficiency. It is always best to be mindful of any known interactions with your analytes when planning your analyses to guarantee stability and safety. Volatility and Evaporation Rate Volatility affects a solvent’s ability to evaporate, directly impacting its evaporation rate and vapor pressure. A high evaporation rate minimizes residual solvent and impurities reaching the detector, reducing background noise in the measurements. This also enhances sensitivity and accuracy at the detector, making these solvents ideal for certain methods. For efficient LC-MS analysis, volatile solvents like methanol and acetonitrile are commonly preferred due to their quick evaporation rates. When selecting a solvent, consider how its volatility will impact the transition of analytes from a liquid phase to a gas phase effectively. Along with the evaporation rate, boiling point is another indicator of what volatility is best for your analysis. UV Transparency UV transparency impacts how mass spectrometers use solvent-based UV detection methods in conjunction with LC-MS by influencing how ultraviolet light (UV) absorbs, scatters, or passes through certain materials. Assess each solvent’s UV cutoff point and choose one that is transparent across the UV spectrum needed for your analysis. This minimizes interfering absorbance, increasing the accuracy of quantitation in spectroscopic detection. Solvents with higher UV transparency also provide a clearer baseline and improved peak distinction, particularly at low wavelengths. Methanol and acetonitrile have excellent transparency and are often chosen when UV detection is required. Viscosity Viscosity relates to the fluidity of a solvent and the ease of flow through a system, ultimately affecting the flow rate and mixing efficiency. This can be detrimental to other components, especially in chromatography and tests that require passing a mobile phase through a column and stationary phase. Different sample compositions also may require an increase or decrease in viscosity to prepare for spectrometry analysis. pH With ionization being a fundamental function of mass spectrometry, the pH of your solvent is an important consideration. Acidic solutions measure higher concentrations of free hydrogen ions, while basic solutions will have less of their abundance. This directly influences ionization techniques, signal intensity, and solvent compatibility with a particular analyte. Buffers and acidic additives are often used to balance the pH of mixtures and enhance ionization by protonating a sample, thus improving detection in positive mode. Selecting a Solvent for Mass Spec As highlighted above, there are quite a few considerations when it comes to choosing a solvent for mass spectrometry, chromatography, or any analytical test that requires precision and the interaction of many chemical properties. Among these factors, certain solvents have become popular choices due to their ideal nature for these tests based on their particular attributes: Acetonitrile: Highly volatile and compatible with many analytes. Methanol: Offers low viscosity and is versatile. Tetrahydrofuran (THF): Suitable for certain applications, though less common due to chemical instability and compatibility issues. Dichloromethane: Useful in specific scenarios due to its solubility properties, but often limited due to chemical compatibility issues. Water: Can be mixed with other solvents to create optimal conditions for different analytes, including pH and viscosity. Select the correct purity grade to avoid impurities that could introduce contaminants or inaccuracies. Various solvent blends are also available to meet different application needs. They can be purchased pre-made or mixed in a lab. The choice between these blends can influence ionization efficiency, requiring careful optimization and precision. Always consider solvent specifications before purchasing yours, which follow global standards and should be listed on each bottle or in product details. To find the best solvent for your mass spectrometry or chromatography needs, explore our selection at Birch Biotech.

Mastering Solvent Evaporation in LC-MS: Sample Preparation Techniques and Tips
Learn about solvent evaporation and sample preparation techniques ideal for LC-MS.

Understanding High-Purity Solvent Specs: Essential Insights for Researchers
Discover how high-purity chemical specifications are verified and learn how to use them to guide your research.
Essential Sample Preparation Techniques for LC-MS Analysis
Discover LC-MS sample preparation techniques for reliable, accurate results.
Best Solvents for Peptide Analysis in LC-MS: Preparing Solutions and Overcoming Challenges
Discover how to use solvents for peptide analyses with LC-MS.
